- 04 Sep, 2026
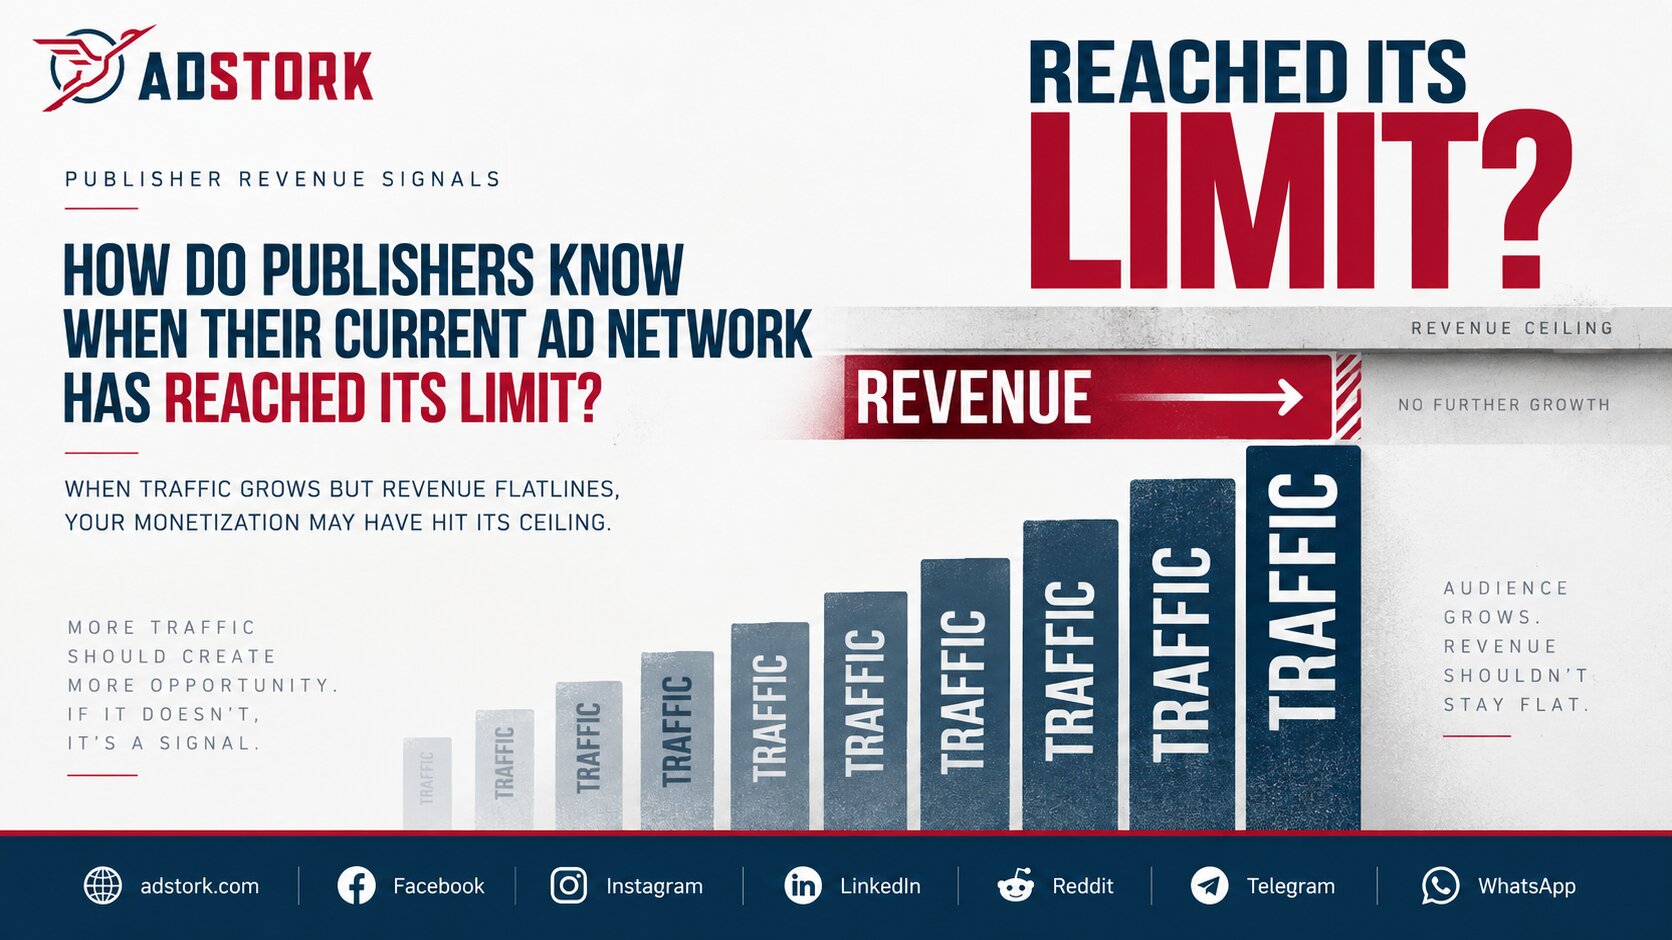
How Do Publishers Know When Their Current Ad Network Has Reached Its Limit?
Your traffic is growing. Your content is strong. But your ad revenue has flatlined. You've tweaked placements, tested formats, and adjusted floors—yet nothing moves the needle.
This is the quiet signal that your current ad network may have reached its limit.
The challenge is that revenue declines rarely look like a crisis in your dashboard. A 10% CPM compression over four weeks looks like normal market volatility. It gets attributed to seasonal slowdowns or advertiser budget cycles. The problem underneath goes unfound.
This guide walks you through nine critical signals that indicate your ad network has reached its limit—and how to distinguish temporary noise from structural underperformance.
Key Takeaways
- Revenue plateaus despite traffic growth are the clearest sign your network has hit its ceiling.
- Declining eCPM without market explanation signals demand gaps or optimisation failures.
- Fill rate drops from 78% to 64% over weeks can look like normal variance—until it doesn't.
- Technical issues like misconfigured floors or unsynced auctions can silently drain revenue.
- The "honeymoon phase" after switching is temporary—judge performance only after 60 days of data.
- If your network hasn't adapted to AI-driven traffic shifts or cookie deprecation, it's falling behind.
1. Revenue Has Plateaued Despite Traffic Growth
This is the most obvious signal. Your traffic is increasing—but your ad revenue is flat or declining.
When audience growth no longer translates to revenue growth, your monetisation is not scaling with your traffic. Your network may be struggling to attract incremental demand for your growing inventory, or it may be optimising for metrics that don't capture the full value of your audience.
As one publisher noted, "Display CPMs are flatlining, and the buy side is consolidating around fewer, larger deals." If your network isn't accessing those premium deals, your revenue will stagnate even as your traffic grows.
What to check: Compare your traffic growth rate against your revenue growth rate over the last 6-12 months. If the gap is widening, your network is not capturing value from your incremental audience.
2. CPM and eCPM Are Declining Without Market Explanation
If your eCPMs are falling while industry benchmarks remain stable, your current platform likely has demand gaps or optimisation issues that newer competitors have already solved.
Programmatic revenue depends on the quality and accuracy of the signals your inventory sends to advertisers. When those signals degrade—because of misconfigured tags, broken audience segmentation, or outdated technology—your inventory looks less valuable than it actually is.
The result: CPMs drop. Fill rates decline. And your revenue dashboard shows numbers that look normal because they are only slightly lower than last week, and slightly lower the week before that.
What to check: Export 60-90 days of eCPM and CPM data. Compare against industry benchmarks. If your numbers are declining while benchmarks are stable, your network is underperforming.
3. Fill Rate Is Dropping Consistently
Every ad request that doesn't get filled is lost revenue. A fill rate decline from 78% to 64% over three weeks might look like normal programmatic variance—until it doesn't.
Low fill rates create a vicious cycle: advertisers and ad networks use publisher fill rate data as a signal of inventory reliability. Publishers with consistently low fill rates may receive fewer competitive bids, further reducing both fill rate and eCPM.
If traffic quality is questionable, DSPs and their partners may avoid bidding on that inventory. For a publisher with high traffic volume, poor quality will mean many unsold impressions.
What to check: Track fill rate by geography, device, and format. If specific segments are underperforming, your network may lack demand in those areas.
4. Bid Density Is Declining
Bid density—the number of bids per auction—is a leading indicator of advertiser interest. When bid density drops, it means fewer buyers are competing for your inventory.
Server-side header bidding can reduce browser-side latency, but in some cases, it can lead to lower bid density or CPMs. Lower match rates or lower signal quality can reduce buyer competition and put downward pressure on CPMs.
When auctions are not synchronised properly, good bids never reach the final auction. A small technical detail, but a big impact on fill rate and auction pressure.
What to check: Review your header bidding wrapper and Google Ad Manager alignment. If valid demand never reaches the final auction, fill rate drops and impressions go unserved.
5. Technical Issues Are Going Unresolved
Simple configuration gaps can quietly cost publishers significant revenue. When ad networks fail to address technical issues, revenue leaks compound over time.
Common technical issues include misconfigured floor prices that reduce fill rates, unsynchronised auctions that prevent good bids from reaching the final auction, and consent signal loss that reduces eligible demand.
If your network isn't proactively identifying and fixing these issues, your revenue is silently leaking.
What to check: Audit your ad stack configuration. Are floor prices optimised dynamically? Are your wrapper and ad server synchronised? Are you losing consent signals?
6. Support Has Become Unresponsive
When your ad network's support team stops providing meaningful optimisation guidance, it's a signal that your account is no longer a priority.
The best ad networks provide dedicated account management, proactive optimisation recommendations, and quick resolution of technical issues. If you're getting generic responses or no responses at all, your network has likely moved on to larger accounts.
What to check: Review your support interactions over the last 3-6 months. Are you receiving proactive optimisation advice? Are technical issues resolved quickly? Do you have a dedicated account manager?
7. The Network Hasn't Adapted to Industry Changes
The advertising industry is evolving rapidly. In Q2 2026, publisher ad request volumes fell 32% to 37% year over year in the U.S. and 39% to 41% in the U.K. Publisher ad supply on the open web fell by up to 40%.
If your network hasn't adapted to these changes—by embracing server-side header bidding, supporting new formats like CTV, or optimising for first-party data—it's falling behind.
Networks that don't invest in AI-driven optimisation, transparent reporting, or diversified demand sources will struggle to maintain performance as the market shifts.
What to check: Does your network support header bidding? Do they offer dynamic floor pricing? Are they investing in first-party data solutions? Have they adapted to cookie deprecation?
8. The Honeymoon Phase Has Faded Without Sustained Improvement
When publishers switch ad networks, they often experience a significant RPM jump in week one, followed by a painful dip around day 30. This is the technical reality of how programmatic systems learn, sync, and recalibrate.
Short-term spikes after switching are usually temporary, as DSPs, cookie syncing, and price floors need 30 to 60 days to settle into a true baseline.
If your current network delivered an initial boost but performance has since stabilised below expectations, it may have reached its limit for your traffic profile.
What to check: Judge a new stack only after 60 days of data. If performance hasn't improved beyond your previous network's baseline, the new network may not be a significant upgrade.
9. Reporting Has Become Opaque
Ad networks should provide dashboards accessible to every publisher to track performance in real time. This helps you analyze their performance and identify data discrepancies.
If your network's reporting is opaque—lacking granular data by geography, device, format, and placement—you cannot optimise effectively. You're operating in the dark.
The best networks provide transparent, real-time reporting that shows you exactly what is happening with your inventory. If yours doesn't, it's time to reconsider.
What to check: Can you see fill rate, eCPM, and revenue by geography, device, and format? Can you export data for custom analysis? Do you have access to bid-level data?
If you're seeing these signals, it may be time to evaluate whether your current network can still deliver for your growing business. Adstork provides transparent reporting, multiple demand sources, and dedicated support to help publishers scale their revenue. Explore Adstork's publisher solutions and see how a modern ad network can help you break through your revenue ceiling.
Comparison Table: Healthy Network vs. Network at Its Limit
A quick reference guide to distinguish a healthy ad network from one that has reached its limit.
| Signal | Healthy Network | Network at Its Limit |
|---|---|---|
| Revenue vs. Traffic | Revenue grows with traffic | Revenue plateaus despite traffic growth |
| eCPM Trend | Stable or growing vs. benchmarks | Declining without market explanation |
| Fill Rate | Consistent (80%+) | Dropping consistently |
| Bid Density | Multiple competitive bids | Declining competition |
| Technical Support | Proactive, responsive, knowledgeable | Unresponsive, generic, slow |
| Industry Adaptation | Embracing new formats, AI, first-party data | Stagnant, outdated technology |
| Reporting | Transparent, granular, real-time | Opaque, limited, delayed |
Industry Insight: The Hidden Cost of Staying Too Long
The cost of staying with a network that has reached its limit is not always visible in your dashboard. It's a slow, silent drain on your revenue.
At the scale of programmatic advertising, even a silent 10% compression in effective CPMs across a publisher's inventory translates to significant annual revenue loss. The problem is that a 10% CPM compression over four weeks rarely looks like a crisis in a dashboard.
Many publishers also know that CPMs fluctuate, fill rates vary, and some revenue loss is just part of how the ecosystem works. What far fewer publishers know is how much of that lost revenue is not a market problem—it is a data or partner problem.
One publisher noted that sales teams would sometimes overpromise on impression volume, leaving ops teams scrambling to deliver campaigns when the actual site traffic falls short. If your network is overpromising and underdelivering, it has reached its limit.
What to Do Next: A 4-Step Action Plan
If you're seeing multiple signals that your network has reached its limit, here is a structured approach to evaluating your options.
Step 1: Audit your current setup. Export 60-90 days of data from your existing dashboard. Include RPM by geography, fill rate, eCPM, and revenue per session.
Step 2: Identify the gaps. Compare your performance against industry benchmarks. Where are you underperforming? Is it fill rate in certain geos? eCPM on mobile? Support responsiveness?
Step 3: Test alternatives. Partition a portion of traffic towards new ad configurations before switching your site over wholesale. Run a controlled test with a new network on a limited segment.
Step 4: Evaluate after 60 days. Short-term spikes after switching are temporary. Judge a new stack only after 60 days of data. Compare effective RPM, fill rate, and revenue per session—not just headline CPM.
Your ad network has a limit. The question is whether you've reached it—and whether you'll recognise the signals before revenue loss compounds.
The nine signals in this guide—revenue plateaus, declining eCPM, dropping fill rates, weakening bid density, unresolved technical issues, unresponsive support, failure to adapt, faded honeymoon phases, and opaque reporting—are your early warning system.
If you're seeing multiple signals, it's time to evaluate your options. The cost of staying too long is not always visible in your dashboard—but it's real.
Adstork helps publishers break through revenue ceilings with transparent reporting, multiple premium demand sources, and dedicated support. Sign up for a free Adstork publisher account and see what a modern ad network can do for your revenue.
Your immediate action plan: Audit your current performance against the nine signals. Identify your biggest gaps. Research 2-3 alternative networks that address those gaps. Run a controlled test on a limited segment. Evaluate after 60 days. Make a data-driven decision.
FAQs
How do I know if my ad network has reached its limit? Look for nine signals: revenue plateaus despite traffic growth, declining eCPM without market explanation, dropping fill rates, weakening bid density, unresolved technical issues, unresponsive support, failure to adapt to industry changes, faded honeymoon phase without sustained improvement, and opaque reporting.
What is a normal eCPM fluctuation vs. a sign of network failure? A 10% CPM compression over four weeks rarely looks like a crisis in a dashboard. If your eCPMs are declining while industry benchmarks are stable, your network likely has demand gaps or optimisation issues.
How long should I wait before switching ad networks? If you've recently switched, judge performance only after 60 days of data. If you've been with a network for over a year and are seeing multiple decline signals, start evaluating alternatives immediately.
Should I switch networks entirely or add a second one? Many successful publishers use multiple networks in a header bidding setup. Adding a network can introduce competition without disrupting existing revenue. Test before you switch.
What metrics should I track to monitor network performance? Track revenue per session, fill rate by geography and device, eCPM, bid density, and viewability. Don't rely on headline CPM alone—it can be misleading.
Can technical issues make a network look like it's underperforming? Yes. Simple configuration gaps can quietly cost publishers significant revenue. Misconfigured floor prices, unsynchronised auctions, and consent signal loss can all reduce fill rates and eCPM.




Leave a Comment